「1D OLED View the results」:修訂間差異
跳至導覽
跳至搜尋
無編輯摘要 |
無編輯摘要 |
||
| (未顯示同一使用者於中間所作的 1 次修訂) | |||
| 第24行: | 第24行: | ||
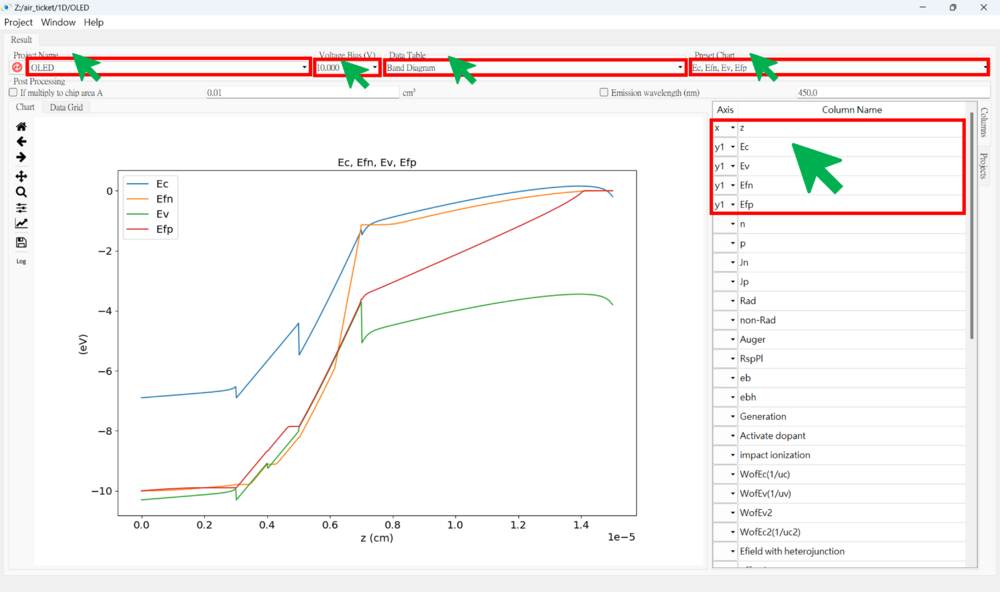
★ Ec, Ev, Efn and Efp (10V) <br><br> | ★ Ec, Ev, Efn and Efp (10V) <br><br> | ||
[[File:1D_OLED_17.png|1000px]]<br><br> | [[File:1D_OLED_17.png|1000px]]<br><br> | ||
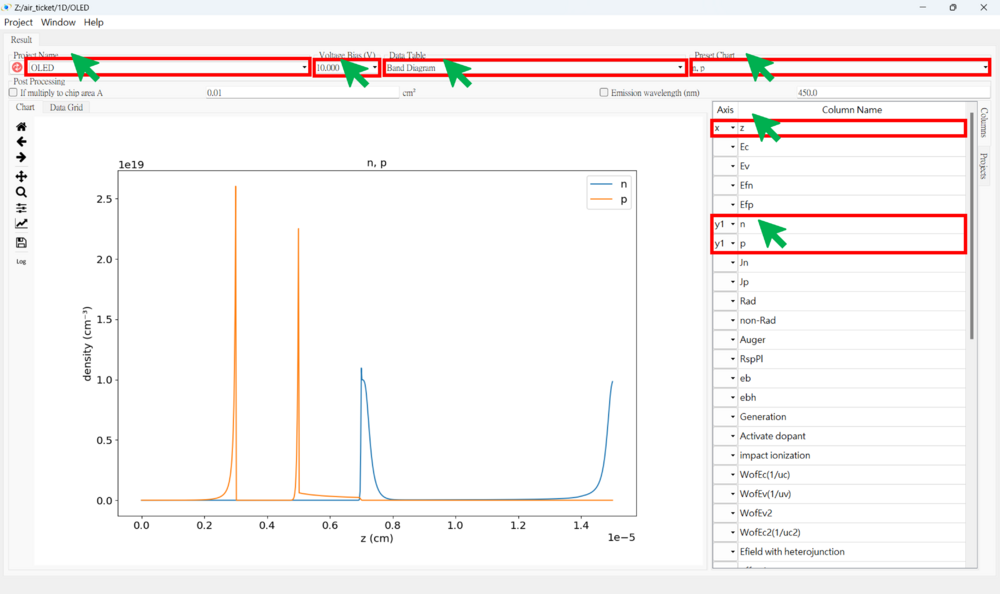
'''● Carrier Density figure <br><br>''' | |||
★ n and p <br><br> | |||
[[File:1D_OLED_18.png|1000px]]<br><br> | |||
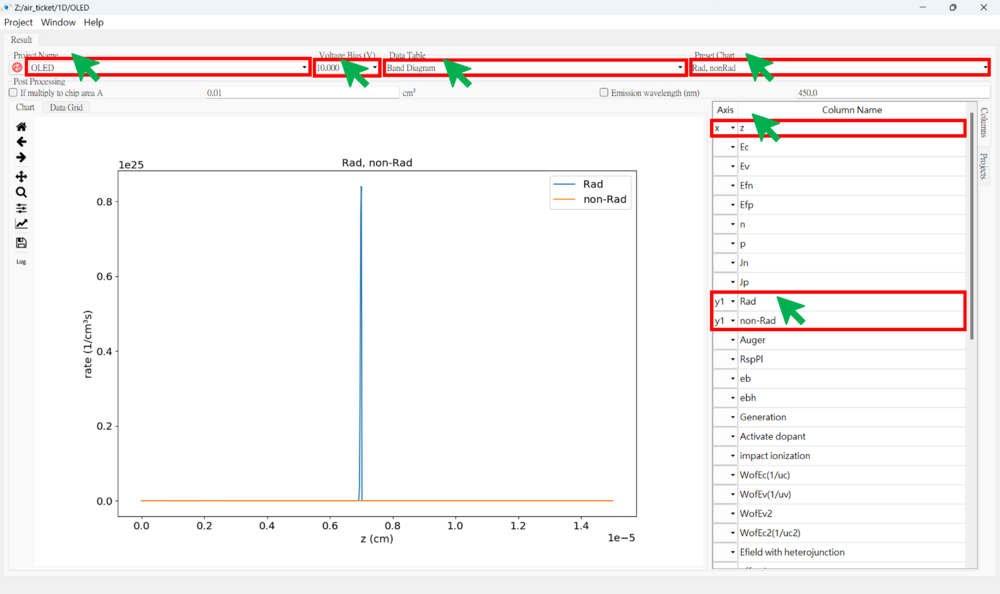
'''● Radiative and Non-Radiative Rates figure <br><br>''' | |||
[[File:1D_OLED_19.png|1000px]]<br><br> | |||
於 2025年1月11日 (六) 13:32 的最新修訂
● Press the result viewer button
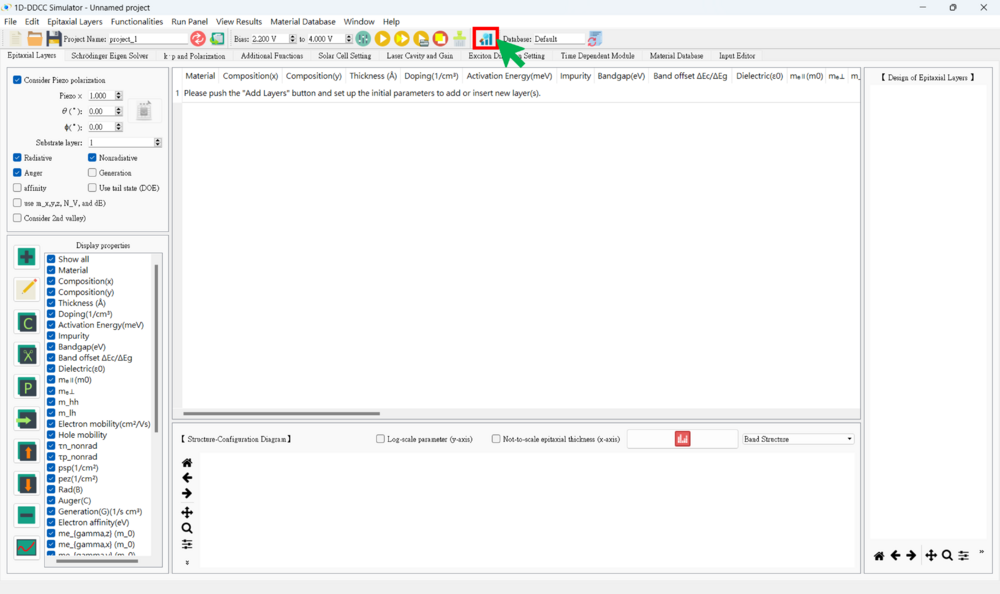
● 1D Result SOP
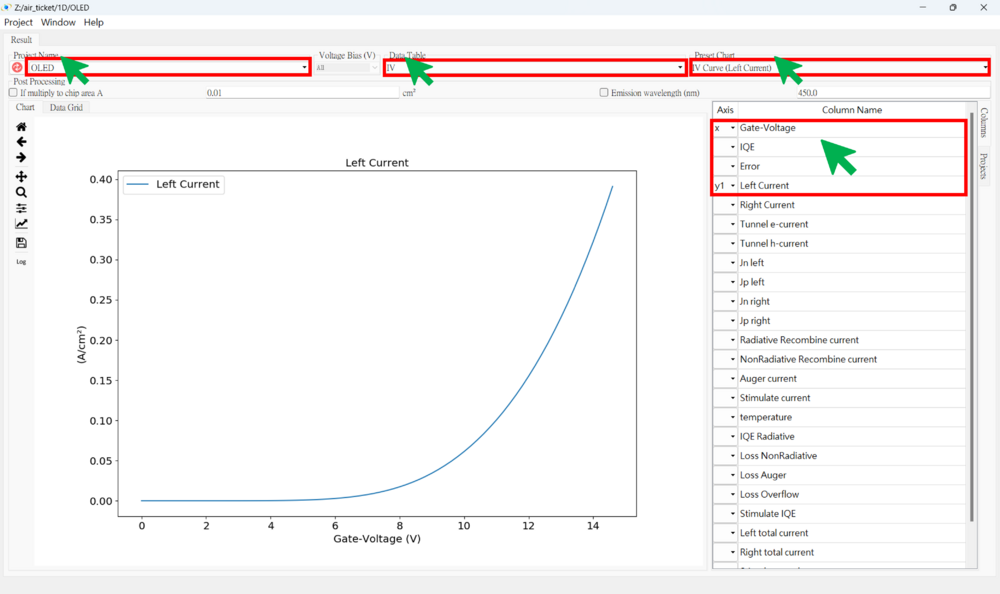
1. Choose the project name
2. Choose the data type
(1)  Band Diagram (Usually Use)
(2)  IV (Usually Use)
(3)  CV and Sum of each layer
3. Selecting voltage points (if necessary)
4. Choose the x-axis and y-axis data
★★★ There are some result examples for this case. ★★★
● IV figure (linear)
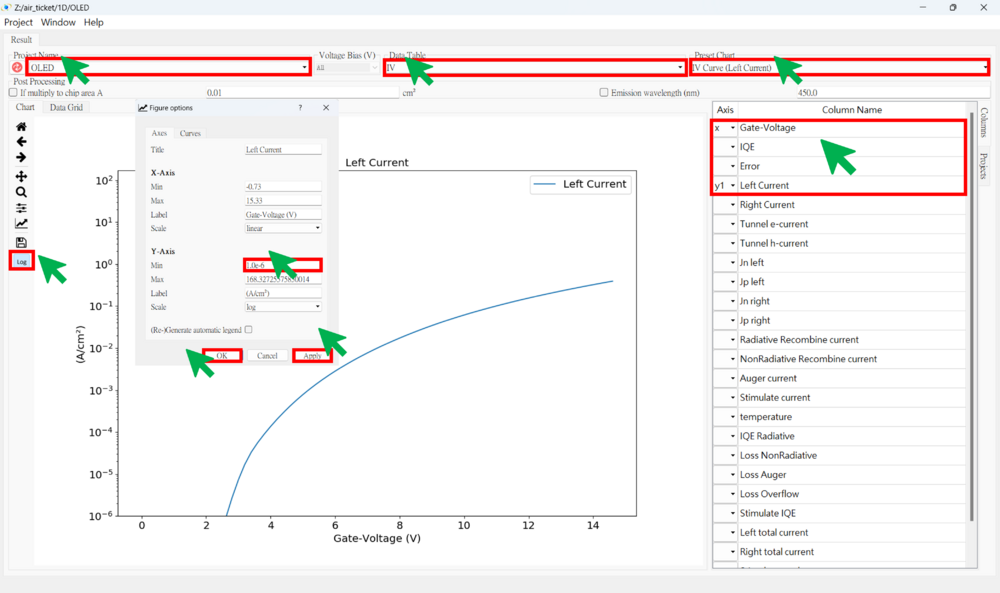
● IV figure (log)
★ Change the range of the y-axis.
● Band structure figure
★ Ec, Ev, Efn and Efp (0V)
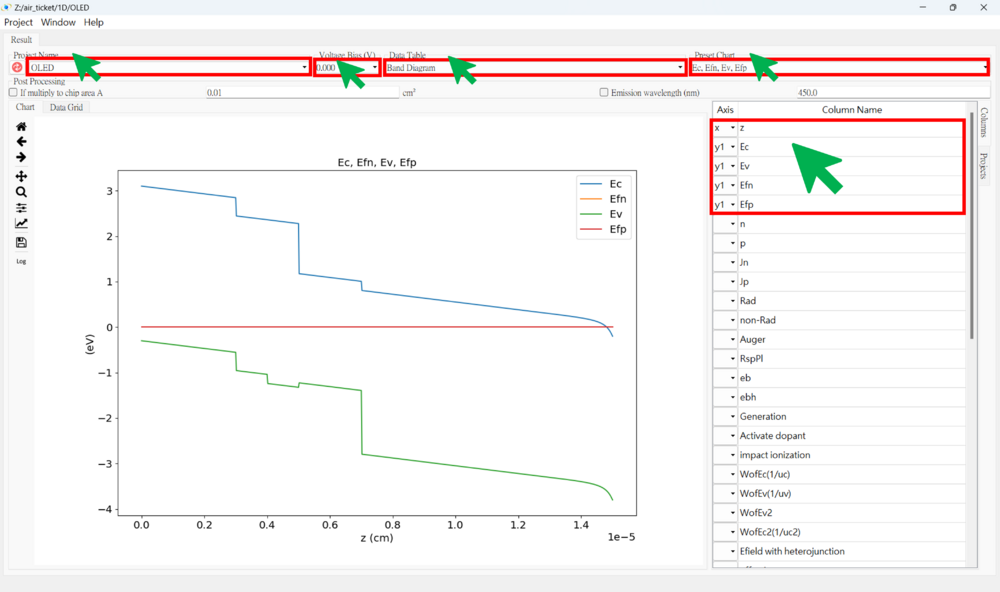
★ Ec, Ev, Efn and Efp (10V)
